
In this article I am revisting an article from three years ago: “Speeding up libclang on Windows”, in which I was having a look at how the experimental Clang Code Model was handling a particular source code file.
With the help of Profile Guided Optimization I was able to go down from 10 seconds to 6 seconds.
In the meantime the Clang Code Model has been enabled by default in Qt Creator 4.7.
Three years ago I tested Qt Creator 3.6.0, Qt 5.5.1, LLVM/Clang 3.6.2, MinGW GCC 5.3.0, Visual C++ 2013/5. I tested on a Lenovo W510 Thinkpad with an “Intel(R) Core (TM) i7 CPU M 620 @ 2.67 GHz” CPU.
Now I am going to test Qt Creator 4.8.2, Qt 5.12.2, LLVM/Clang 7.0.1, MinGW GCC 7.3.0, and Visual C++ 2017. I upgraded my laptop to a Lenovo A485 Thinkpad with an “AMD Ryzen 7 Pro 2700U w/ Radeon Vega Mobile Gfx 2.20 GHz” CPU.
How many seconds would it take libclang to parse the file? TL;DR? 3 seconds!
Setting up the development environment
Since my A485 Thinkpad was brand new I had to set up my development environment.
I installed Visual Studio 2017 Community Edition, for the Visual C++ 2017 compilers.
Then I went to get the Qt 5.12.2 builds, and to my surprise, instead of various compiler builds of Qt, there was only one: qt-opensource-windows-x86-5.12.2.exe 3.7GiB.
The above package has the Qt 5.12.2 Visual C++ 2017 32 and 64bit, MinGW GCC 7.3.0 32 and 64bit Qt and compiler / debuggers.
This is not something new, the download.qt.io/official_releases/qt has this one executable bundle since Qt 5.9.0.
It was nice not to hunt for MinGW GCC builds. This package comes with everything. Well, almost everything. One needs to get the cdb.exe debuggers to be able to debug
Visual C++ projects in Qt Creator.
Because I had installed Visual Studio 2017 community, I only had to go to Control Panel to “Programs and Features” and “Change” the “Windows Software Development Kit - Windows 10.0.17763.132” and select the “Debugging Tools for Windows”.

It is very nice to have Qt with batteries included (MinGW GCC compiler, GDB Debugger, and Qt libraries)!
Building libclang
Now to see how the Ryzen CPU performs at compiling a project like LLVM/Clang.
I downloaded LLVM and clang source packages, unpacked them like this (using Git Bash):
$ tar xf llvm-7.0.1.src.tar.xz
$ tar xf cfe-7.0.1.src.tar.xz
$ mv cfe-7.0.1.src llvm-7.0.1.src/tools/clang
And run the following CMake cmd script (from the appropriate cmd shell):
cmake ^
  -B llvm-7.0.1.build ^
  -S llvm-7.0.1.src ^
  -G "Ninja" ^
  -DCMAKE_BUILD_TYPE=Release ^
  -DCMAKE_INSTALL_PREFIX=c:\llvm ^
  -DLLVM_TARGETS_TO_BUILD=X86

cmake -E time ^
  cmake --build llvm-7.0.1.build --target libclang

cmake -E time ^
  cmake --build llvm-7.0.1.build --target install
To my surprise it took:
- Visual C++ 2017 64 bit: 43m:36s for the libclang target, and 22m:27s for install
- MinGW 7.3.0 64 bit: 52m:43s for the libclang target, and 22m:02s for install
Three years ago on my old laptop it took like 20m to build the libclang target.
I guess the Clang code base got bigger, and the C++ compilers got complexer. But then again I have more, and faster CPU cores on this laptop than the old one. Hmmm.
libclang compilation with GCC
While compiling I noticed in “Task Manager” that the CPU speed was fluctuating, even though I selected “High Performance Mode” in Lenovo’s tools.
I though I should visit the BIOS settings, where I disabled the “AMD PowerNow!” feature in Bios.
Now the MinGW 7.3.0 64bit results are: 51m:13s for the libclang target, and 20m:00s for the install target. The results are only a bit better. I also had the Real-time Windows Defender protection, and the search indexing for the C: drive disabled.
Since I have a dual boot system (two encrypted SSDs), I tried the same setup on my KDE Neon (Ubuntu 18.04 LTS based) Linux.
The GCC 7.3.0 build results were: 27m:22s for the libclang target, and 10m:33s.
I knew that GCC is optimized on Linux, but almost twice as fast?!
AMD Power Slider
While compiling on Windows I noticed that the “Task Manager” was showing the CPU usage not as 100%. On Linux there the “Task Manager” was showing 100%.
So I had closer look at Windows power options in Control Panel, and found the “AMD Power Slider”, which I set for “Best performance” while plugged in.

How does the “Best performance” look like?
- Visual C++ 2017 64 bit: 34m:30s for the libclang target, and 14m:02s for install
- MinGW 7.3.0 64 bit: 34m:03s for the libclang target, and 13m:52s for install
The result are waaaaaay better. Both compilers seem to have similar performance, but less than what I got on Linux.
RAM Drive
I had (crazy) idea, how about a RAM Drive? I took the ImDisk Toolkit, created a 512MB drive, then run a benchmark:
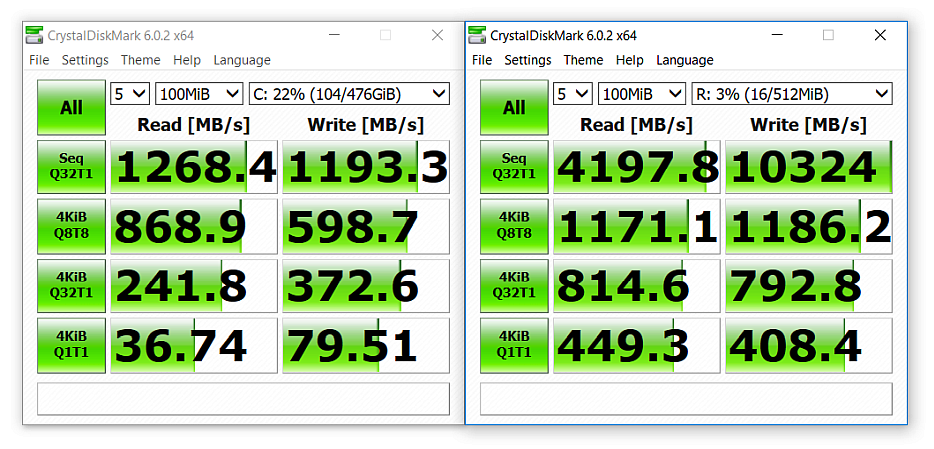
The RAM Drive is a few times faster than my SSD Drive!
I copied the whole mingw730_64 (450MiB) folder to R: and ran the compilation. The results were: 32m:42s for libclang target, and 12m:35s for the install target.
The results are not what one would expect, which shows that Windows is caching the read files. Well, duh!
Setting up Lyx
I took Lyx from git, and I had to download the lyx-windows-deps-msvc2015.zip manually,
since the Lyx’s CMake machinery doesn’t work out of the box. I also had to comment the include("${TOP_CMAKE_PATH}/LyxPackaging.cmake") line, which assumed different things on MinGW.
I used this script to configure the project and then import it in Qt Creator.
::set kit=mingw73_64
set kit=msvc2017_64

cmake ^
  -B build-%kit% ^
  -S lyx ^
  -GNinja ^
  -DCMAKE_BUILD_TYPE=Debug ^
  -DGNUWIN32_DIR=lyx-windows-deps-msvc2015 ^
  -DCMAKE_PREFIX_PATH=c:\Qt\Qt5.12.2\5.12.2\%kit%\lib\cmake
I configured two builds, one with Visual C++ and one with MinGW “kits”, then imported the builds in Qt Creator.
Clang parsing of Text3.cpp
Then I went to set the QT_LOGGING_RULES=qtc.clangbackend.timers=true environment variable, which should make Qt Creator to display logging
information in the DebugView tool.
Nothing was displayed in DebugView. It took me a while to find out why 
Qt Logging stops sending messages to the platform’s preferred logging mechanism if you have message handler installed.
This patch fixed it:
diff --git a/src/tools/clangbackend/clangbackendmain.cpp b/src/tools/clangbackend/clangbackendmain.cpp
index 5cbac3ce60..2e6badeac7 100644
--- a/src/tools/clangbackend/clangbackendmain.cpp
+++ b/src/tools/clangbackend/clangbackendmain.cpp
@@ -57,8 +57,11 @@ QString processArguments(QCoreApplication &application)
 }

 #ifdef Q_OS_WIN
+#include <Windows.h>
 static void messageOutput(QtMsgType type, const QMessageLogContext &, const QString &msg)
 {
+    OutputDebugStringW(msg.toStdWString().c_str());
+
     std::wcout << msg.toStdWString() << std::endl;
     if (type == QtFatalMsg)
         abort();
Now I was able to see these lines in DebugView.
[10504] UpdateAnnotationsJobRunner needed 3732 ms
[10504] UpdateExtraAnnotationsJobRunner needed 519 ms
Profile Guided Optimization
In order to do a profile guided optimzation one has to change the compiler flags.
For the instrumentation part I used a toolchain file, and added it to the CMake call:
-DCMAKE_TOOLCHAIN_FILE=%cd%\toolchains\msvc.pgo.instrument.cmake
For Visual C++ the toolchain looks like this:
set(CMAKE_CXX_FLAGS_RELEASE_INIT "/GL")
set(CMAKE_SHARED_LINKER_FLAGS_INIT "/LTCG:PGINSTRUMENT")
For MinGW the toolchain looks very similar:
set(CMAKE_CXX_FLAGS_RELEASE_INIT "-fprofile-generate")
set(CMAKE_SHARED_LINKER_FLAGS_INIT "-fprofile-generate")
For the optimization part, I failed to come up with a toolchain file, due to the fact that I need to reuse an already configured CMake project, and my attempts to have a clean solution failed.
Then I manually replaced in build.ninja:
- For Visual C++:
/LTCG:PGINSTRUMENTwith/LTCG:PGOPTIMIZE - For MinGW:
-fprofile-generatewith-fprofile-use -Wno-error=coverage-mismatch
Visual C++ 2017 PGO instrumentation resulted in a whooping build directory size of 27.8GiB, from 1.58GiB which was the size of the regular build.
Also the instrumented binary is like an order of magnitude slower (~60seconds), while the MinGW counterpart was not that bad (~9seconds). I’m approximating because I haven’t saved the instrumentation DebugView results.
Clang build of libclang
I also gave Clang 7.0.1 64 bit build a try. My build script changed a bit:
set PATH=c:\Program Files\LLVM\bin\;%PATH%
set INCLUDE=c:\Program Files\LLVM\lib\clang\7.0.1\include;%INCLUDE%
set CC=clang-cl
set CXX=clang-cl

cmake ^
  -B llvm-7.0.1.build ^
  -S llvm-7.0.1.src ^
  -G "Ninja" ^
  -DCMAKE_BUILD_TYPE=Release ^
  -DCMAKE_INSTALL_PREFIX=c:\llvm ^
  -DLLVM_TARGETS_TO_BUILD=X86

cmake -E time ^
  cmake --build llvm-7.0.1.build --target libclang

cmake -E time ^
  cmake --build llvm-7.0.1.build --target install
The build times were: 44m:04s for libclang target, and 16m:36s for the install target.
“AMD Power Slider” was still at best performance, but I enabled back “AMD PowerNow!”. Hmm.
Clang also has PGO support. The CMake instrumentation toolchain looked like this:
set(CMAKE_CXX_FLAGS_RELEASE_INIT "-fprofile-instr-generate=c:/llvm/clang.pgo")
set(CMAKE_SHARED_LINKER_FLAGS_INIT "-fprofile-instr-generate=c:/llvm/clang.pgo")
Unfortunately the instrumentation build failed, with lots of errors like:
AsmWriterInst.cpp.obj : error LNK2001: unresolved external symbol __llvm_profile_register_names_function
Attributes.cpp.obj : error LNK2001: unresolved external symbol __llvm_profile_register_names_function
As it turns out, CMake cannot use clang.exe and clang++.exe from the official LLVM/Clang windows distribution
with a MinGW compiler, as explained in the #18880 CMake issue:
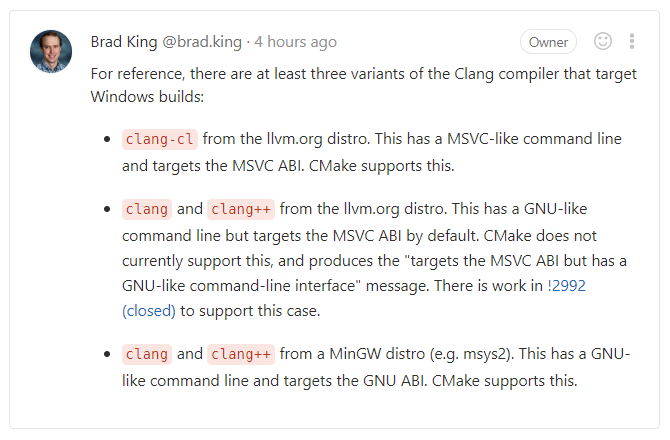
I also tried my MinGW 64 Clang build as a Clang C++ compiler. Unfortunately CMake didn’t like it either. Different error.
Clang produced slightly bigger binaries than Visual C++, slightly faster than a normal Visual C++ build, but slower than
a Visual C++ PGO build. Will the Clang PGO build beat the Visual C++ PGO build? I will give it a go some day, but not today
Results, Results, Results
The results from below are the median values of ten Text3.cpp file open, then wait for parsing.
I included also a run of my MinGW64 PGO build with the %temp% folders in the RAM Drive.
| Compiler | Time to compile | Binary size | Visual C++ kit | MinGW kit |
|---|---|---|---|---|
| Qt Creator clang official 64 |
- | 89.2 MiB | 4227.7 ms | 3358.8 ms |
| Visual C++ 2017 64 | 34m:30s | 27.1 MiB | 5417.7 ms | 4373.5 ms |
| Visual C++ 2017 64 PGO | 47m:15s+ | 21.6 MiB | 4573.4 ms | 3816.7 ms |
| Clang 7.1.0 64 | 44m:04s | 31.3 MiB | 5181.1 ms | 4213.4 ms |
| MinGW 7.3.0 64 | 32m:42s | 53.4 MiB | 4652.3 ms | 4191.8 ms |
| MinGW 7.3.0 64 PGO | 1h:48m:46s+ | 46.9 MiB | 4317.5 ms | 3467.9 ms |
| MinGW 7.3.0 64 PGO RAM Drive |
1h:48m:46s+ | 46.9 MiB | 4252.1 ms | 3123.0 ms |
Compared with the results from three years ago, the compile times have increased, the binary files have increased, but running times have decreased! I assume mostly due to faster hardware.
Did I mention that Qt Creator is shipping a PGO optimized version of libclang.dll on Windows? 
Hardware
I bought my Lenovo A485 at the end of 2018, got a nice price offer. I tried the Lenovo A485 configurator again, this time with 32GB of RAM.
I have 16GB (2x8GB), thus I can’t actually use a bigger RAM Drive and put the whole Visual C++ and Microsoft Windows SDKs there. ImDisk Toolkit lets you to preload a disk image!
The following Lenovo A485 Thinkpad:
- CPU: AMD Ryzen 7 PRO 2700U (2MB Cache, up to 3.8 GHz)
- OS: Windows 10 Pro 64
- Screen: 35.6cm (14.0”) FHD (1920x1080), IPS, without Touch
- Internal Battery: 3 cells Lithium-Ion 24Wh
- Back battery: 6 cells Lithium-Ion 72Wh
- Power supply: 65 Watt
- Wifi: Realtek RTL8822BE 802.11ac WLAN with Bluetooth
- RAM: 32 GB(2x 16GB) DDR4 2.400 MHz SODIM
- Graphics: AMD Radeon Vega
- Camera: 720p-HD with ThinkShutter
- HDD: 512 GB SSD, M.2 2280, PCIe, OPLAL 2.0
Costs (in Germany) 2010,06€, but with a price deduction of 361,81€ ends up to cost 1648,25€.
I bought a second 512GB SSD for 130€ (which now costs 86€!), following the advice from this Reddit A485 fully upgraded with aftermarket parts thread.
Am I doing this right, Lenovo?